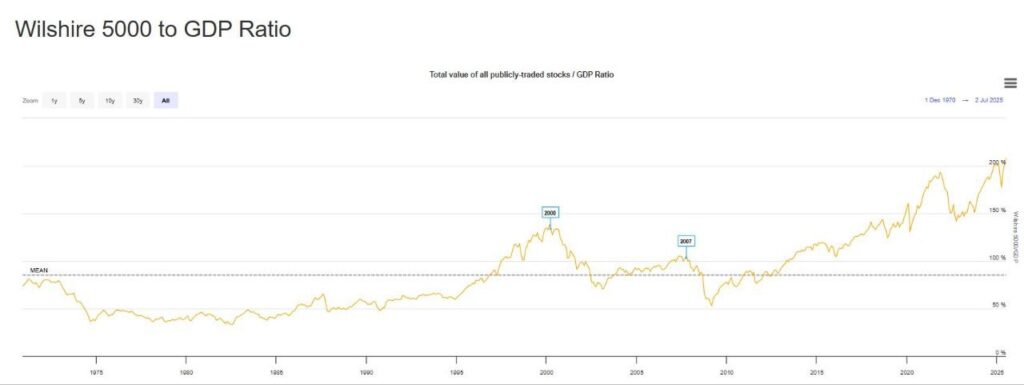
The U.S. financial market has just crossed a historic threshold that is catching the eye of vigilant investors. The so-called Buffett Indicator, which compares the total value of stocks traded in the country to the U.S. GDP, has reached 209%, the highest level on record.
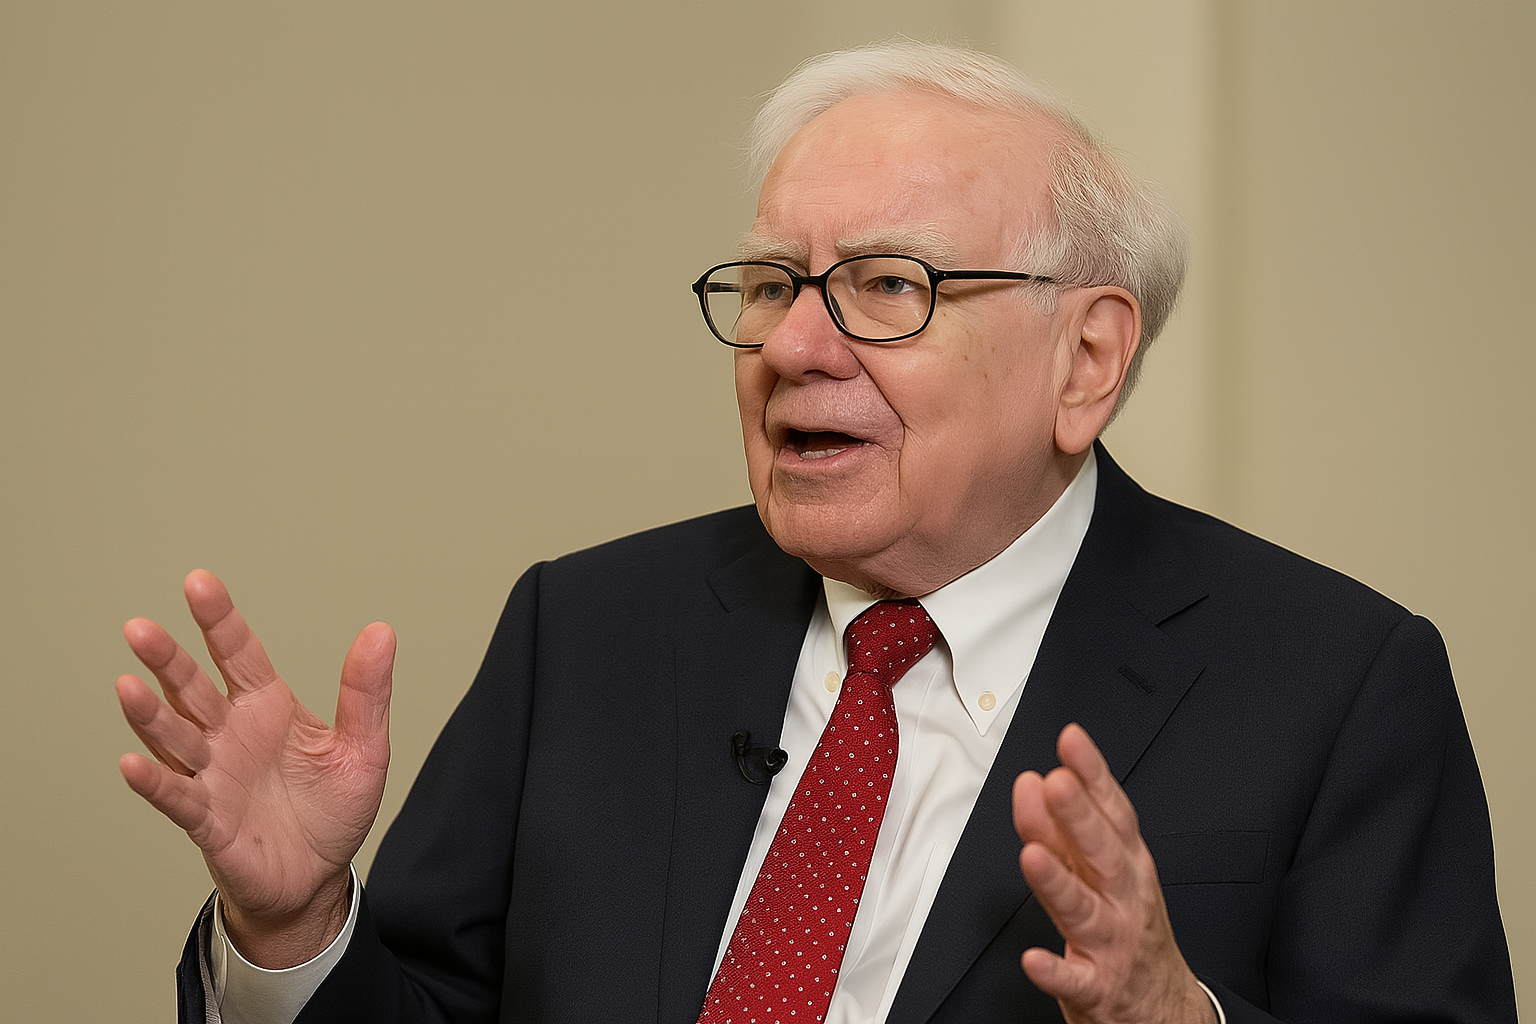
This indicator became widely known after being popularized by Warren Buffett, who has long argued it is one of the best ways to measure whether the stock market is overpriced or undervalued compared to the real economy. When the figure sits around 100%, it means the market is roughly aligned with the size of the economy. Anything above that suggests stocks could be overvalued.
Now, at 209%, the U.S. equity market is worth more than double the country’s GDP. For perspective, during the dot-com bubble in the early 2000s, this indicator hovered near 140%. Before the subprime crisis in 2007, it stood around 105%. Today’s level has simply never been seen before.
That raises an important red flag. Historically, whenever the index climbed far above average, the market eventually corrected in the following years. This risk only grows if we see higher interest rates, economic slowdowns or negative revisions to corporate earnings.
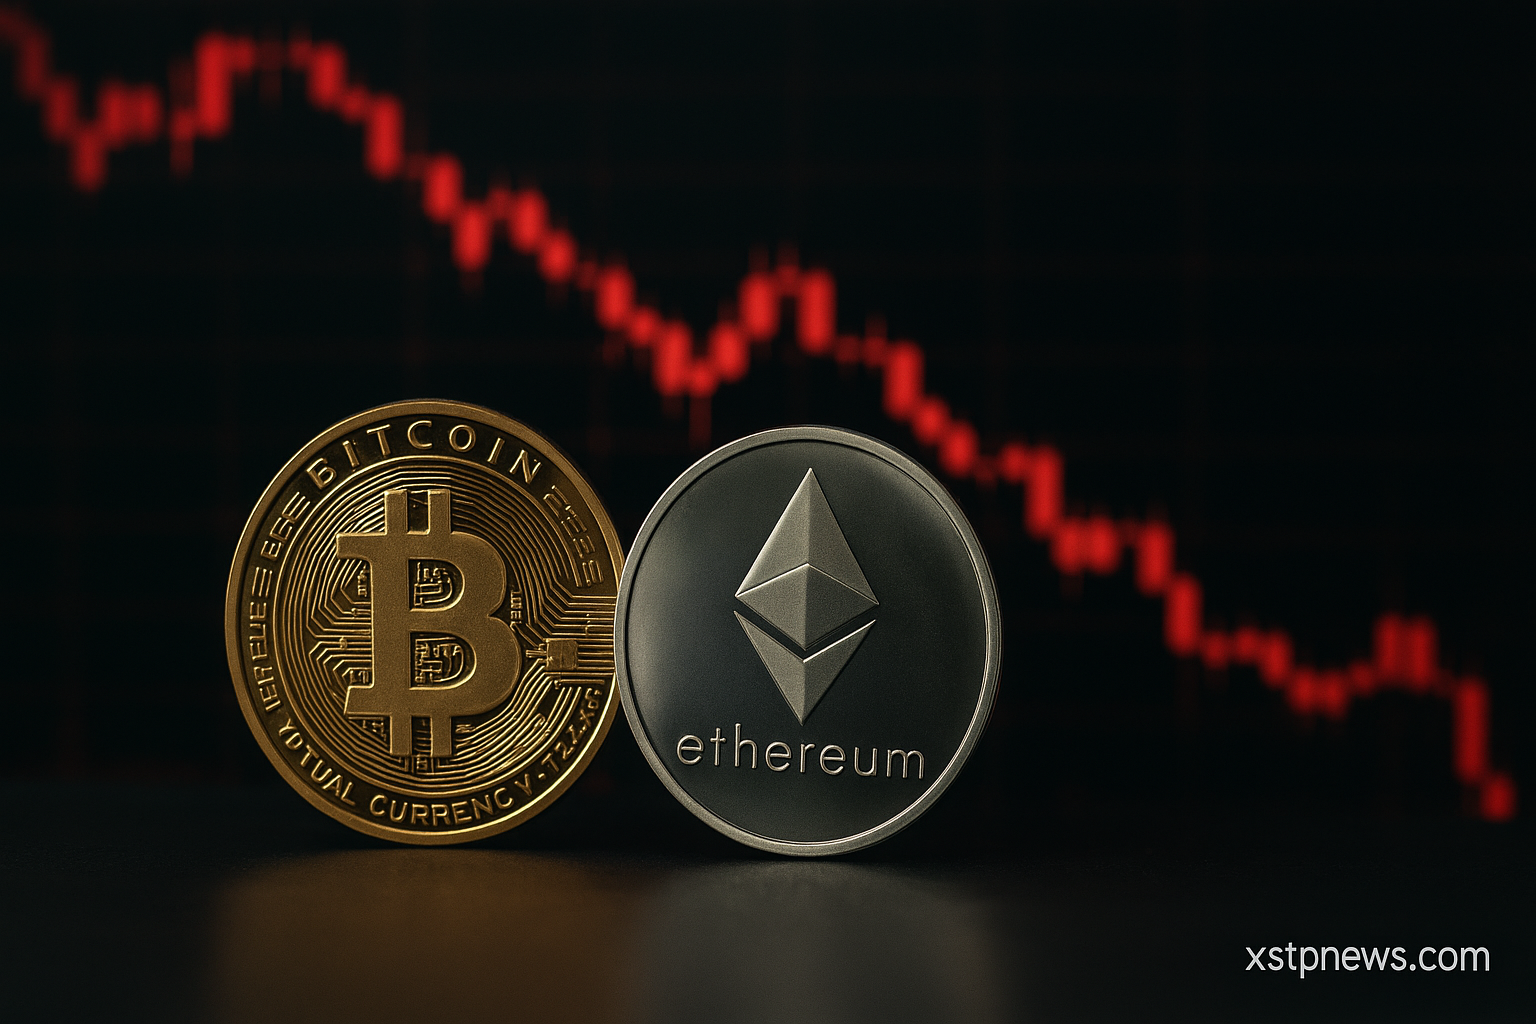
The impact doesn’t stop at the U.S. stock market. Inflated markets usually pull in liquidity across all asset classes, including cryptocurrencies and tokenized startups. But the opposite is also true: when cheap money disappears, the first to feel it are typically the higher-risk investments.
On the other hand, those who stay disciplined, hold cash reserves and keep a long-term outlook often find excellent opportunities when markets adjust. It’s in these moments that projects with solid fundamentals tend to stand out and capture more ground.