
To the untrained eye, Bitcoin might look like it’s simply moving sideways.
But with the lens of our Functional Technical Analysis course, this is a textbook case of compression before directional expansion.
Let’s decode it with precision.
Current Context: Range Compression and Historical Pattern
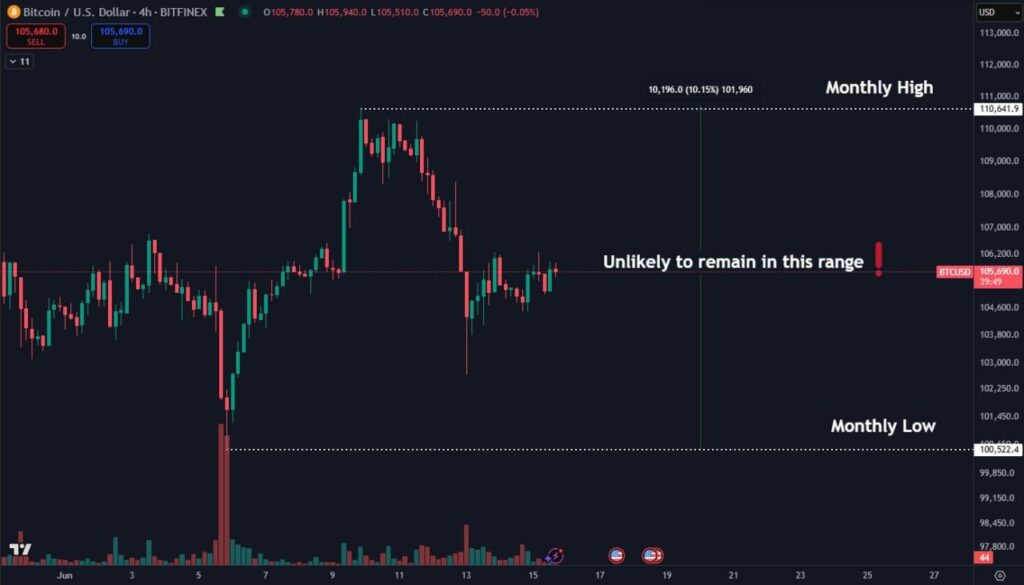
Bitcoin is currently trading near the midpoint of its monthly range, with a total high-to-low spread of about 10 percent.
In the past 48 months, every single monthly candle had a larger price displacement than this.
This tells us one thing clearly. Either the current monthly high or low is very likely to be broken before this candle closes.
The trap is set. Now we wait for confirmation.
Functional Technical Analysis in Action
1. Reading the Range and Liquidity Setup
As taught in our “False Structures and Traps” module, mid-range price behavior is often a trap zone.
When price hovers in the center, it creates indecision while large players position themselves.
Real liquidity is located at the extremes. That is where breakout orders, stop losses, and pending trades accumulate.
This means we should expect a sweep of at least one side.
The market rarely remains compressed without purpose.
Institutional Logic: Accumulation Followed by Displacement
This current structure fits the A plus D pattern we break down in the course: Accumulation then Displacement.
Institutions accumulate passively. They absorb liquidity while maintaining a narrow price band.
Once that process is complete, they create a displacement move. That move is rarely small.
The current narrow monthly range signals the final phase of absorption. Expansion is coming.
Multi-Timeframe Context and Candle Psychology
We always reinforce the importance of higher timeframe context.
This monthly candle is still wide open.
Historically, institutional players do not allow a monthly candle to close with low volatility unless by design.
This strongly suggests unfinished business and a likely continuation move in one direction before month-end.
What Comes After the Break
Retail traders often expect a fakeout and reversal.
That is a mistake in this type of context.
This structure shows signs of compression followed by a sustained expansion move.
We do not expect just a liquidity sweep. We expect momentum to build after the breakout.
This is a setup for ignition, not just a stop hunt.
Tactical Takeaways for Traders
Avoid entries in the middle of the range. That is a noise zone.
Wait for a clean breakout followed by confirmation.
Look for:
- A clear break in structure
- Impulsive candles with strong body size
- Minimal rejection wicks near key zones
Initial target: the opposite side liquidity.
Main target: projected range expansion using the previous consolidation zone.
Final Thought
“Amateurs react to price. Professionals respond to context.”
This is one of those moments where being patient and precise will separate real traders from hopeful guessers.